 NOC Services
Why Infrastructure Monitoring is Essential for Scaling IT Teams



Downtime Draining Your Business? Fix It Before It Costs More
Missed alerts turn into outages, outages turn into lost revenue. ExterNetworks Inc. delivers 24/7 NOC & Help Desk support to keep everything running smoothly.
Get 24/7 IT Support NowWhat is Infrastructure Monitoring? It’s a Strategic Shift from Reactive to Proactive Infrastructure Oversight
Infrastructure monitoring has evolved beyond a back-office IT function; it’s the operational foundation that separates scaling businesses from those constantly fighting fires.
So, what is infrastructure monitoring, exactly? At its core, it’s the continuous collection and analysis of health data from every layer of your IT environment: servers, networks, storage, and the software running on top. Think of “infrastructure” as the hardware, software, and network foundations your business runs on. When any of those layers falter, the business feels it immediately.
For years, IT teams operated on a break-fix model: something fails, someone notices, someone scrambles to fix it. That model made sense when infrastructure was simple, and downtime was a minor inconvenience. It doesn’t hold up in today’s distributed, always-on environments.
The shift to proactive oversight fundamentally changes that dynamic. Instead of reacting to outages, your team tracks trends, catches anomalies, and resolves issues before users notice a slowdown. The underlying components worth monitoring include:
- Servers and compute: CPU load, memory utilization, and process health
- Network infrastructure: Latency, packet loss, and bandwidth consumption
- Storage and data layers: Disk health, I/O performance, and capacity thresholds
This is where a managed NOC becomes indispensable. Think of it as the central nervous system for all that incoming data, ingesting telemetry, filtering noise, and acting on what actually matters. Let’s explore how that data flows from collection to actionable insight.
How Infrastructure Monitoring Works: From Data Collection to Insight
Effective infrastructure monitoring transforms raw telemetry into actionable insight, turning thousands of data points into the situational awareness your team needs to prevent outages before users ever feel them.
Data collection is where it all starts, and the method matters. Most IT infrastructure monitoring tools collect data through one of two approaches: agent-based or agentless. Agents are lightweight software installed directly on a host, providing deep, granular visibility into CPU usage, memory consumption, disk I/O, and running processes. Agentless collection, by contrast, pulls data remotely via protocols like SNMP or WMI, which is useful when installing software on every device isn’t practical. In practice, mature environments use both, layering them to close coverage gaps.
Once collected, that data flows into a central platform as telemetry, a combination of metrics, logs, and traces. Monitoring involves collecting data from diverse sources, then analyzing it in real time and alerting on anomalies; each telemetry type serves a distinct purpose: metrics track performance over time, logs capture discrete events, and traces map how requests travel across systems. Together, they give you a complete operational picture, not isolated fragments.
The data lifecycle typically follows four steps:
- Collect: Agents or agentless methods continuously pull raw data from servers, network devices, and cloud infrastructure.
- Ingest: Data streams into a centralized platform where it’s normalized and stored for analysis.
- Analyze: Threshold rules and anomaly detection algorithms evaluate incoming data against baseline performance benchmarks.
- Alert: When a threshold is breached, automated notifications route to the right team through predefined escalation paths; no manual watching required.
Visualization is the final layer that makes it actionable. Dashboards surface trends, anomalies, and system health scores in real time, giving your team immediate situational awareness without digging through raw logs. A well-configured dashboard is the difference between catching a disk filling up at 80% capacity and discovering a failed server at 2 a.m.
Understanding this workflow highlights why monitoring extends beyond the infrastructure layer; it sets the foundation for everything running on top of it, including your applications.
Infrastructure Monitoring vs. Application Monitoring: Knowing the Difference
Infrastructure monitoring and Application Performance Monitoring (APM) address different layers of your stack, and confusing the two is one of the most common gaps in modern observability strategies.
Infrastructure monitoring focuses on host health: CPU utilization, RAM consumption, disk I/O, and network throughput. It answers: Is the machine running? APM, by contrast, focuses on code health and the experience it delivers to users. It tracks response times, error rates, transaction traces, and dependency failures. As LogicMonitor notes, infrastructure monitoring provides visibility into the physical or virtual hardware layer, while APM looks at software execution.
These two disciplines are complementary, not interchangeable. You can have clean application metrics while a host quietly degrades underneath until it doesn’t. A memory leak, a saturated disk, or a CPU spike at the infrastructure vs. application monitoring boundary is exactly where teams lose precious diagnostic time. The app looks fine until the host gives out.
In a modern cloud-native environment, these layers interact in more complex ways. Containerized workloads, auto-scaling groups, and serverless functions blur the lines between “where the code runs” and “what the code runs on.” A reliable application demands a healthy foundation. That’s why a well-structured NOC monitoring approach covers both layers in tandem rather than treating them as separate concerns.
Understanding this distinction sets the stage for something equally important: knowing when each layer matters most. The use cases for infrastructure monitoring are more specific and more consequential than many teams realize.
Critical Use Cases for Modern IT Environments
Infrastructure monitoring is more than a single-purpose tool; it’s the operational backbone behind your most high-stakes IT decisions.
The previous sections covered how monitoring collects and correlates data across your stack. But understanding where that capability pays off in real-world scenarios makes the value concrete. Common use cases include cloud migration, capacity planning, and troubleshooting performance bottlenecks, and each one carries serious business risk if handled reactively.
Cloud migration is one of the most disruptive events an IT environment faces. Without baseline telemetry captured before the move, you have no reliable way to confirm performance parity after workloads shift. Monitoring gives your team the before-and-after visibility to catch regressions early, not after users start complaining.
Capacity planning stops being guesswork when you have historical trend data. Instead of reacting to a server hitting 95% CPU utilization at 2 a.m., you can see the trajectory weeks out and schedule upgrades during planned maintenance windows. That’s the difference between controlled growth and crisis management.
Incident response is where monitoring directly compresses MTTR. When an alert fires, a team supported by managed NOC services can pinpoint whether the failure is hardware, network, or application-layer, skipping the hours of blind troubleshooting that drag resolution times out.
Compliance and auditing round out the picture. Continuous log collection creates the audit trail that regulatory frameworks like HIPAA, PCI-DSS, and SOC 2 require without manual effort from your already-stretched team.
Knowing what monitoring does in practice naturally raises the next question: which platform actually delivers it best? The next section breaks that down.
The Top 5 Infrastructure Monitoring Tools for 2025-2026
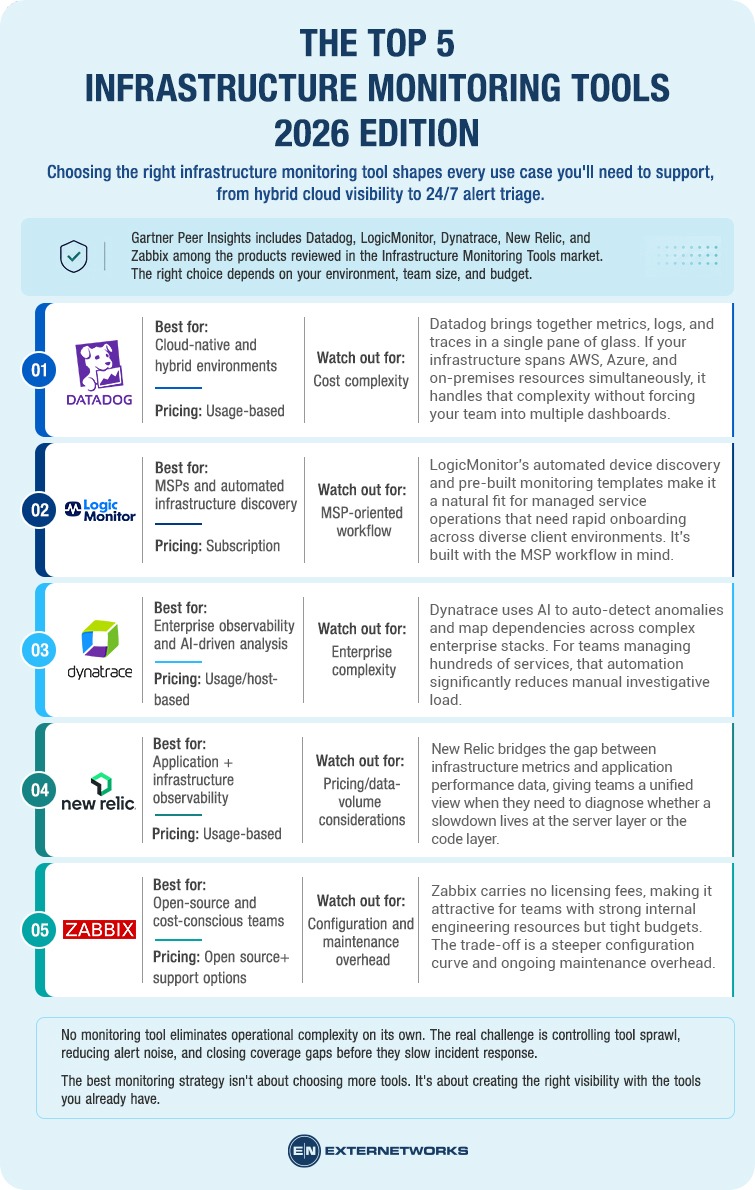
Choosing the right infrastructure monitoring tool shapes every use case you’ll need to support, from hybrid cloud visibility to 24/7 alert triage.
Gartner Peer Insights identifies Datadog, LogicMonitor, and Dynatrace as consistent market leaders, but the right fit depends on your environment, team size, and budget. Here’s how the top five stack up heading into 2026.
- Datadog: Best for cloud-native and hybrid environments. Datadog brings together metrics, logs, and traces in a single pane of glass. If your infrastructure spans AWS, Azure, and on-premises resources simultaneously, it handles that complexity without forcing your team into multiple dashboards.
- LogicMonitor: Best for automated discovery and MSPs. LogicMonitor’s automated device discovery and pre-built monitoring templates make it a natural fit for managed service operations that need rapid onboarding across diverse client environments. It’s built with the MSP workflow in mind.
- Dynatrace: Best for AI-driven observability in large enterprises.Dynatrace uses AI to auto-detect anomalies and map dependencies across complex enterprise stacks. For teams managing hundreds of services, that automation significantly reduces manual investigative load.
- New Relic: Best for integrated infrastructure and application views. New Relic bridges the gap between infrastructure metrics and application performance data, giving teams a unified view when they need to diagnose whether a slowdown lives at the server layer or the code layer.
- Zabbix: Best for open-source flexibility and cost-conscious teams. Zabbix carries no licensing fees, making it attractive for teams with strong internal engineering resources but tight budgets. The trade-off is a steeper configuration curve and ongoing maintenance overhead.
No tool eliminates operational complexity on its own, and that’s exactly where the real challenge begins. Beyond selecting the right platform, most teams quickly discover that tool sprawl, alert noise, and coverage gaps create friction that slows down response. That’s worth examining closely.
Overcoming the Challenges of Tool Fatigue and Alert Noise
When every alert demands attention, your team stops trusting the system, and that’s when real incidents slip through undetected.
The tools covered in the previous section are powerful, but deploying them doesn’t automatically solve your operational problems. In practice, more monitoring tools often means more noise. Alert fatigue and tool sprawl are primary challenges that lead to missed incidents and operational burnout, and for scaling IT teams, this is less an edge case than a daily reality.
“When everything is a priority, nothing is.” This is the lived experience of engineers buried under thousands of alerts per day, many of which are duplicates, false positives, or low-severity events that don’t require immediate action.
Data silos compound the problem further. When your network team runs one tool, your cloud team runs another, and your application team uses a third, you’re not building observability; you’re building blind spots. Correlation becomes manual, escalation slows down, and the proactive monitoring benefits you invested in get eroded by fragmented workflows.
Cost of ownership is another hard reality. Licensing fees stack up quickly, but the hidden cost is the specialized engineering talent required to configure, tune, and maintain these platforms around the clock. That points to the deeper challenge: maintaining true 24/7 coverage in-house demands staffing levels most IT teams can’t sustain without burnout or budget overruns.
The tools can generate the data. But without the right people and processes acting on it, you’re still reacting. That gap between monitoring data and meaningful action is exactly where a managed approach changes the equation entirely.
Managed NOC Services: The Strategic Alternative to DIY Monitoring
Monitoring tools generate data, but data alone doesn’t prevent outages. You need experienced people to act on that data around the clock, with clear escalation paths and defined ownership.
That’s the gap most IT teams and MSPs hit eventually. You’ve invested in the right platforms, configured your dashboards, and set your alert thresholds. But when a P1 incident fires at 2 a.m., who’s responding? If the honest answer is “whoever’s on call and hoping for the best,” you don’t have a monitoring strategy; you have a monitoring tool.
The difference with a managed NOC isn’t about replacing your stack. It’s about putting trained engineers behind it who treat your infrastructure like their own. That means 24/7/365 oversight without the overhead of recruiting, training, and retaining a round-the-clock operations team. According to IBM, effective infrastructure monitoring depends as much on the processes and people interpreting signals as on the technology collecting them.
Here’s what that looks like in practice when comparing managed NOC support against in-house monitoring alone:
- Operational coverage without staffing pressure: A managed NOC scales with your environment, adding monitored endpoints, new clients, or hybrid workloads without requiring you to hire additional headcount for every growth phase.
- Proactive issue resolution: Alerts get triaged, validated, and escalated before they become customer-facing outages, turning your monitoring investment from a reactive cost into a predictable operational advantage.
- True team extension: Integrated workflows, shared visibility, and transparent reporting mean your internal team stays informed and in control, not sidelined by a black-box vendor.
That shift from tool management to operational confidence is what separates teams that scale sustainably from those that stay stuck in firefighting mode. And it connects directly to a broader question worth examining: what does a mature, complete approach to infrastructure monitoring actually require?
The Bottom Line: What You Need to Know About Infrastructure Monitoring
Infrastructure monitoring is the foundation of IT reliability, and for scaling MSPs and IT teams, it’s no longer a nice-to-have; it’s the operational baseline that separates proactive teams from reactive ones.
The case is straightforward. Without consistent visibility across your entire stack, you’re making decisions in the dark. As Splunk notes, effective monitoring requires a combination of the right tools, clear metrics, and an accountable team, not any single element alone. That combination is exactly what most organizations struggle to build and sustain at scale.
Visibility is the non-negotiable starting point. Your monitoring strategy has to span cloud, on-prem, and hybrid environments without gaps. Blind spots don’t stay quiet; they surface as outages at the worst possible moment, costing you client trust and revenue in the same breath.
Proactive prevention separates mature infrastructure strategies from reactive firefighting. Faster reaction times matter, but they’re a fallback position. The real win is identifying drift, degradation, and anomalies before they reach your users or your customers.
The tool-versus-managed-service decision ultimately comes down to your internal capacity. A managed NOC partner gives you data plus the experienced team to act on it continuously, around the clock, without burning out your staff.
- Monitoring must cover every layer of your environment
- Metrics only drive outcomes when paired with human accountability
- Proactive oversight reduces downtime; reactive monitoring only limits damage
- Scale demands a strategy your internal team can realistically sustain
If any of these gaps sound familiar, the next step is taking an honest look at where your current monitoring strategy falls short and what it’s actually costing you.
Next Steps: Auditing Your Infrastructure Strategy
The most dangerous monitoring gap isn’t the one you know about; it’s the one quietly eroding your uptime, your SLA commitments, and your team’s capacity right now.
Start by auditing what you actually have. Map your current coverage against your most critical infrastructure components: servers, networks, cloud workloads, and endpoints. Where are the blind spots? Where does alert triage depend on a single person being awake at 2 a.m.? Those gaps aren’t just operational inconveniences. They’re business risks with measurable price tags.
Then run the numbers honestly. The cost of proactive oversight, structured monitoring, defined escalation paths, and expert-led response almost always comes in well below the cost of a single significant outage. When you factor in lost productivity, customer churn, emergency remediation, and reputation damage, reactive approaches rarely win on the balance sheet.
This is where ExterNetworks becomes invaluable. Rather than layering another tool onto an already stretched team, ExterNetworks operates as an extension of your team, following your escalation playbooks, delivering transparent reporting, and catching issues before users ever feel them. The operational complexity doesn’t disappear; it just stops landing entirely on your desk.
You’re not alone in this journey. If you’re ready to transform infrastructure monitoring from a pressure point into a predictable, managed function, let’s start a conversation.
Request an operational audit and speak with an expert today.
Related on ExterNetworks Right Now!




Most Recent Posts