 NOC Services
Best Agentless Network Monitoring Software for Windows and Linux 2026



Downtime Draining Your Business? Fix It Before It Costs More
Missed alerts turn into outages, outages turn into lost revenue. ExterNetworks Inc. delivers 24/7 NOC & Help Desk support to keep everything running smoothly.
Get 24/7 IT Support NowThe Shift Toward Agentless Infrastructure Oversight
Anyone who has pushed a monitoring agent across a few hundred mixed Windows and Linux hosts knows how the week goes: failed installs on hardened boxes, kernel module conflicts, version drift, change-control tickets for every update. The agent becomes its own infrastructure to maintain.
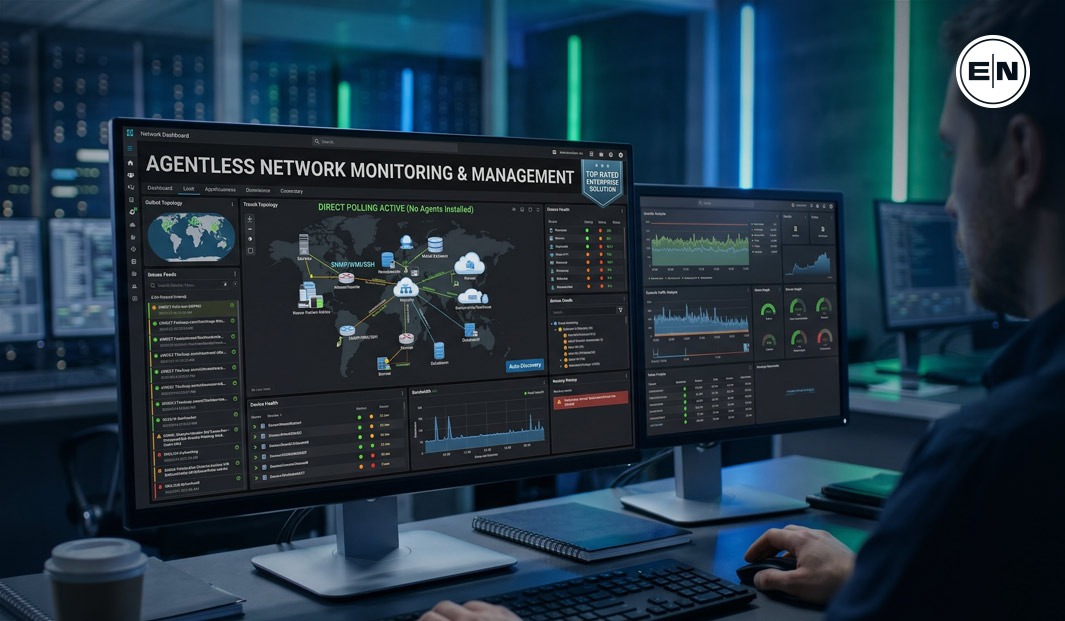
Agentless monitoring sidesteps that entirely. Instead of deploying third-party binaries, it queries what the operating system already exposes: SNMP on network gear, WMI on Windows, SSH on Linux and Unix. The data path is native. There is nothing extra to patch.
Security is a compelling reason. Every agent is code running with privilege on a production server, and every agent is a supply-chain dependency. Removing them shrinks the attack surface and removes an entire category of audit findings. It also unlocks the systems you were never allowed to touch: locked-down appliances, legacy platforms past vendor support, and security-hardened hosts where installing anything is a policy violation.
Agentless isn’t zero-touch; you still configure protocols, credentials, and firewall rules. But done properly, it delivers deep visibility without adding complexity to the thing you’re trying to protect.
Best 5 Agentless Network Monitoring Softwares
1. ManageEngine OpManager: Comprehensive SNMP walking
OpManager’s discovery model starts with an ICMP sweep across defined IP ranges, then walks the SNMP MIB tree on every responding device to classify hardware, enumerate interfaces, and pull performance counters. That two-stage approach is why it handles sprawling multi-vendor estates well; it doesn’t need to know what a device is before it asks.
Topology is built from Layer 2 discovery protocols. By reading CDP and LLDP neighbor tables, OpManager reconstructs the physical link map rather than guessing from subnet membership, which matters when you’re tracing a fault path through stacked switches from three different vendors.
The configuration decision that matters most is version. SNMPv2c authenticates with a plaintext community string, which is effectively a password broadcast across the wire. SNMPv3 with AuthPriv adds authentication and encryption. The industry has largely moved: according to Malanta Research, 84.5% of internet-exposed SNMP devices negotiate the secure SNMPv3 version.
- ICMP sweep plus SNMP walking for credential-light device discovery
- CDP and LLDP parsing for accurate Layer 2 topology maps
- Vendor-neutral MIB handling across heterogeneous hardware
- Full SNMPv3 AuthPriv support for authenticated, encrypted polling
2. Zabbix: Enterprise-grade Open Source Flexibility
Zabbix is the most capable of the network monitoring free tools for teams willing to invest configuration time. Its agentless story is genuinely dual-platform, and it treats SSH and WMI as first-class collection methods rather than afterthoughts.
For agentless Linux monitoring, SSH checks open a key-authenticated session, execute a command, and parse the output. You’re reading df for filesystem capacity, free for memory pressure, top or /proc for process and CPU state. No daemon, no open listening port beyond the one you already run.
On Windows, Zabbix queries WMI directly for service states, disk health, and Event Log entries the same data an agent would surface- pulled over a protocol your domain already trusts.
The tradeoff is clear: while the license is free, engineering time is required. Templates, macros, and trigger logic all require deliberate design.
- Deploy SSH keys to target hosts and restrict the monitoring account to read-only commands.
- Build item prototypes that parse native command output into typed values.
- Configure WMI queries for Windows service and event log checks.
- Template the result so new hosts inherit coverage without rework.
Open Source also means no Vendor Lock-in on Your Telemetry.
3. PRTG Network Monitor: The WMI specialist
PRTG earns its place in Windows-dominant estates because it treats WMI as the primary collection path, not a bolt-on. WMI exposes operating system internals that SNMP doesn’t carry: per-process memory, specific service states, Event Log severity, scheduled task outcomes.
That depth has a cost. WMI calls are heavier than SNMP polls, both on the network and on the queried host’s CPU. SNMP returns a compact OID value over UDP; a WMI query opens a DCOM session and does real work on the far end. The practical rule is to use SNMP for high-frequency interface and throughput polling, and reserve WMI for the granular OS checks where nothing else will do.
Pricing follows a sensor model: each metric you watch counts as one sensor, so WMI-heavy monitoring plans are worth costing out before rollout.
Auto-discovery scans a subnet, identifies devices, and applies sensor templates automatically, which shortens initial deployment considerably. Just budget time for the firewall work: WMI’s dynamic RPC port allocation rarely survives a default enterprise firewall policy without explicit configuration.
4. Domotz: Modern Cloud-based Agentless Discovery
Domotz takes a collector-based approach. A single lightweight appliance or VM sits inside a subnet, performs discovery and polling locally, then ships results to a cloud console. Monitored endpoints receive nothing: no binary, no credentials stored on the host beyond what SNMP or SSH requires.
For distributed enterprises and MSPs managing dozens of client sites, that architecture scales cleanly. One collector per site replaces per-device deployment entirely, and adding a location means provisioning one unit rather than coordinating hundreds of installs across someone else’s change window.
The platform’s strength is automated inventory and live topology. It continuously identifies what’s connected, tracks MAC and manufacturer data, and redraws the network map as things change, which is useful when the documented topology and the actual topology diverged two reorganizations ago.
Integration APIs and multi-tenant views make it practical for MSP workflows, where separating client environments is non-negotiable.
The security posture is worth noting: because reporting flows outbound from the collector, there’s no inbound exposure on monitored servers and no third-party code running on production workloads.
5. Nagios Core: The Industry Standard for Linux
Nagios Core remains the reference implementation for agentless Linux oversight, and the mechanism is straightforward. The check_by_ssh plugin connects to a remote host, runs a standard Nagios plugin locally on that machine, and returns the exit code and performance data. The monitoring logic lives on the Nagios server; nothing persistent lives on the target.
Agentless Linux monitoring over SSH only holds up if key management does. Use dedicated monitoring keypairs with passphrase-less private keys stored on the Nagios host, restrict the remote account’s authorized_keys entry with a forced command, and rotate on a schedule. Password-based SSH for automated polling is not a defensible configuration in any audited environment.
The extensive plugin ecosystem rewards the effort. Two decades of community development means there’s almost certainly an existing check for your database, queue, or specific hardware RAID controller; if not, any script that returns a correct exit code becomes a check.
Configuring Nagios can be challenging. In exchange, you control every polling interval, threshold, and escalation path without negotiating with a vendor roadmap.
Key Takeaways for Agentless Deployment
The tool is less important than the protocol discipline behind it. These principles apply regardless of which platform you select.
- Prioritize SNMPv3 with AuthPriv over community strings. SNMPv1 and v2c authenticate with a plaintext community string that crosses the network unencrypted, making spoofed queries and credential capture trivial. SNMPv3 adds authentication and payload encryption.
- Use SSH keys, never passwords, for Linux monitoring. Automated polling sessions should authenticate with dedicated keypairs, restricted by forced commands in
authorized_keys, and rotated on a defined schedule. - Balance WMI depth against bandwidth and host load. WMI exposes OS internals that SNMP can’t reach, but each query is comparatively expensive. Poll interfaces and throughput via SNMP; reserve WMI for the granular checks that justify the overhead.
- Let auto-discovery maintain your topology, not a spreadsheet. Scheduled ICMP and SNMP sweeps combined with CDP and LLDP parsing keep the map accurate as the network changes.
- Treat firewall and credential planning as part of deployment. Agentless removes installation work; it does not remove the need for scoped service accounts and explicit port policy.
Scale without the Staffing Burden
Agentless architecture solves the deployment problem. It doesn’t solve the alert problem. Once auto-discovery has mapped every device and every interface is being polled, the output is a continuous stream of events, and someone has to decide which ones matter at 3 a.m. on a Sunday. This is where capable teams often struggle. The tooling is fine. The tuning, triage, correlation, and escalation never stop, and they consume the engineers you hired to move the business forward.
ExterNetworks operates as a specialized extension of your team. We take ownership of monitoring-layer thresholds, correlation rules, and your specific escalation playbooks so alerts become decisions, not noise. You get operational health reporting and visible escalation paths, not a daily digest of everything that blinked. Your engineers can refocus on strategic tasks.
If you’ve already selected your tools and the problem is bandwidth rather than visibility, start with an operational audit. We’ll review your current monitoring coverage, alert volume, and escalation workflows to identify the sources of noise.
Request an operational audit to see how we work.
Related on ExterNetworks Right Now!