 NOC Services
6 Best Free Network Monitoring Software for Linux (2026)



Downtime Draining Your Business? Fix It Before It Costs More
Missed alerts turn into outages, outages turn into lost revenue. ExterNetworks Inc. delivers 24/7 NOC & Help Desk support to keep everything running smoothly.
Get 24/7 IT Support NowFor IT leaders and MSPs, maintaining operational confidence means transforming chaotic infrastructure into a predictable business advantage. Selecting the best free network monitoring software for Linux in 2026 is a critical step in preventing downtime and eliminating alert fatigue.
Whether you need the rock-solid stability of a veteran network monitoring tool like Nagios, or the modern automation of a cloud-native open-source network monitoring solution, your choice determines how effectively your team can scale without increasing operational complexity. We’ve analyzed the best Linux monitoring tools 2026 has to offer to help you reclaim your focus and ensure business continuity.
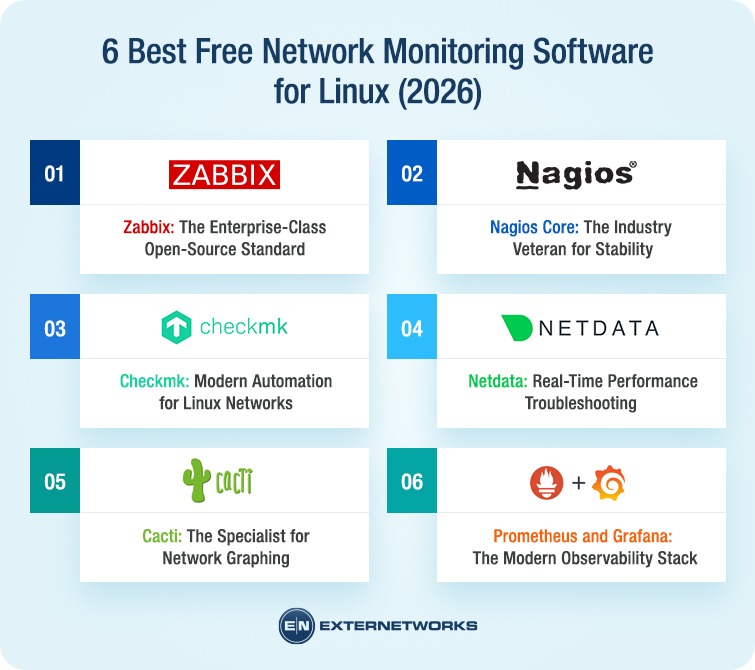
1. Zabbix: The Enterprise-Class Open-Source Standard
When IT leaders evaluate the best free network monitoring software for Linux environments, Zabbix consistently rises to the top, and for good reason. Recognized as the most complete open-source enterprise platform for mixed Linux and network estates, it handles both agent-based and agentless collection (SNMP/IPMI) natively, making it equally at home monitoring a rack of Linux servers or a floor of managed switches.
The “Is Zabbix really free?” question comes up often. The answer is straightforward: Zabbix is 100% open source under the GPL license no hidden tiers, no feature paywalls. What you deploy is the full platform.
Key capabilities that make it enterprise-ready:
- Dual collection modes: agent-based for deep Linux metrics, agentless SNMP/IPMI for network gear
- Built-in auto-discovery: automatically detects new hosts and applies templates without manual intervention
- Template-based configuration: dramatically reduces setup time across complex, mixed estates
- Unified visibility: single dashboard spanning Linux infrastructure and network hardware
Pro Tip: Enable Zabbix’s network discovery rules with action-based auto-linking to host groups. New devices get monitored automatically the moment they join your network; no ticket required. If your team needs that visibility without the configuration overhead, a dedicated NOC team can operationalize Zabbix at scale from day one.
“If you’re managing a mixed Linux and network environment, Zabbix gives you enterprise-grade coverage without the enterprise price tag, but it rewards teams that invest in configuration discipline.”
2. Nagios Core: The Industry Veteran for Stability
Few tools carry the legacy weight of Nagios Core. It’s been a foundational network monitoring tool for Linux environments for over two decades, and its reputation for rock-solid stability hasn’t faded. Its high-performance monitoring engine underpins thousands of community-developed plugins, meaning you can monitor nearly any hardware, service, or protocol your infrastructure relies on.
| Feature | Benefit | Complexity Level |
|---|---|---|
| Massive plugin library | Monitor virtually any device or service | Low — plugins are pre-built |
| Proven monitoring engine | Consistent, reliable alerting over time | Low — stable by default |
| Custom configuration files | Full control over thresholds and checks | High — requires manual editing |
The trade-off is real. Nagios Core rewards patience. Configuration is file-based and verbose, so your first deployment will take time and technical fluency. But once it’s dialed in, it runs. For MSPs managing stable, well-defined environments, that “set it and forget it” core is genuinely valuable, especially when paired with proactive NOC support to triage alerts without burning out your team.
The ideal use case is environments that prioritize longevity and control over modern UX. Nagios Core isn’t trying to be sleek; it’s trying to be dependable.
“If stability is your non-negotiable, Nagios Core earns its place, but budget time for the configuration curve.”
3. Checkmk: Modern Automation for Linux Networks
Where Zabbix demands deep configuration expertise, and Nagios Core leans on its plugin ecosystem, Checkmk takes a different approach, one built around automation from the ground up. For teams managing large-scale Linux deployments, that distinction matters.
Rule-based configuration is Checkmk’s standout advantage. Instead of manually defining every host and service check, the kind of repetitive admin work that slows teams using monitoring software, Nagios Checkmk applies intelligent rules across host groups. Its automation capabilities enable rapid discovery of Linux network services, significantly cutting the manual overhead that traditional tools require. You define the rule once; Checkmk handles the rest at scale.
Edition clarity matters here. The Raw Edition (Open Source) delivers a fully capable monitoring core ideal for teams with budget constraints who still need enterprise-grade Linux visibility. The commercial editions layer on features like distributed monitoring and SLA reporting, which align well with managing infrastructure at scale. The Raw Edition’s performance core is also engineered for low CPU overhead, keeping resource consumption lean even across large host counts.
- Auto-discovery: Detects Linux network services without manual host entry
- Rule-based checks: Apply monitoring logic across entire host groups instantly
- Low overhead: High-performance core designed for efficiency, not just coverage
“If your team is losing hours to manual host configuration, Checkmk’s automation layer is worth evaluating before anything else.”
Next up: if you need per-second visibility with zero configuration friction, Netdata offers something none of the tools covered so far can match.
4. Netdata: Real-Time Performance Troubleshooting
Zero-configuration setup is Netdata’s most immediate advantage. Unlike tools that require hours of agent tuning or plugin configuration the kind of setup work you’d expect from something like Nagios for monitoring Linux environments- Netdata auto-discovers metrics and begins visualizing them within minutes of installation. You get instant Linux system visibility without writing a single config file.
What makes Netdata genuinely different is its per-second monitoring granularity. Most tools poll every 60 seconds, which means transient network spikes the kind that cause a five-second packet loss event disappear before they’re ever recorded. Netdata catches them.
“Netdata provides real-time, per-second monitoring with zero-configuration, making it a powerful solution for immediate troubleshooting.” — Netdata.
Data storage and dashboarding split into two modes: a local agent that stores metrics on-device, or a cloud-connected option for centralized visibility across multiple hosts. For teams managing distributed infrastructure at scale, the cloud dashboard adds meaningful operational context. But for individual server deep-dives or small LAN environments, the local agent is often all you need fast, lightweight, and completely self-contained.
“If you need to diagnose a performance problem right now, Netdata is the tool you open first.”
5. Cacti: The Specialist for Network Graphing
Where Netdata excels at real-time diagnostics, Cacti takes a different lane entirely: long-term trending and historical visualization. As a dedicated open-source network monitoring solution for Linux, Cacti harnesses RRDTool’s data storage and graphing engine to produce detailed, time-series bandwidth charts that reveal patterns other tools miss. If you need to answer “what did our traffic look like six months ago?”, Cacti is built for exactly that question.
SNMP-based polling is where Cacti genuinely stands apart. It excels at pulling interface utilization data from routers, switches, and Linux hosts over SNMP, then rendering it into clean, scheduled graphs. This makes it particularly valuable for MSPs, because Cacti’s user management features let you segment clients, assign permissions, and deliver polished, client-facing bandwidth reports without exposing your entire environment.
It’s worth noting a key distinction: Cacti measures passive, historical throughput, not active bandwidth capacity. For testing raw link performance between two endpoints, a tool like Iperf3 serves a different purpose. You’d typically run both in complementary roles.
When to choose Cacti:
- You need weeks or months of bandwidth history for capacity planning
- Your team manages multiple clients and requires role-based report access
- You’re polling a large number of SNMP-enabled network devices
- You want automated graph generation without manual intervention
“If your priority is trending and reporting over live alerting, Cacti delivers historical depth that few free tools can match.”
For teams that need both historical trending and modern observability in a single stack, the next option redefines what’s possible at the infrastructure level.
6. Prometheus and Grafana: The Modern Observability Stack
When evaluating the best Linux monitoring tools 2026 has to offer, Prometheus and Grafana represent the biggest shift in how infrastructure teams collect, store, and visualize operational data. They’re not a single product; they’re a complementary stack that’s become the de facto standard for cloud-native environments.
Prometheus for Metrics
Prometheus collects time-series data through a pull-based model, scraping metrics from configured endpoints at set intervals. Its power comes from a dimensional data model that lets you filter and aggregate metrics across labels like host, service, or region without predefining schemas. In practice, this means your alerting rules stay flexible as your infrastructure scales. And because Prometheus integrates natively with container orchestration platforms, it moves naturally into modern Linux environments without significant retooling.
Grafana for Visualization
Grafana sits on top of Prometheus (and virtually any other data source) to transform raw metrics into executive-level dashboards your leadership team can actually read. Engineers get granular panels; IT leaders get the uptime and latency trends that matter to the business. On the cost side, pairing these tools with object storage backends like S3 or GCS for long-term log retention can reduce infrastructure monitoring costs by 80-90% compared to commercial SaaS platforms at equivalent data volumes a compelling financial argument for any organization managing tight IT budgets.
“If you’re running cloud-native Linux workloads, Prometheus and Grafana aren’t just a cost-efficient choice; they’re the operational foundation that scales with you.”
Key Takeaways: Choosing the Right Linux Monitor
After reviewing eight tools across the monitoring spectrum, from Zabbix’s enterprise breadth to Prometheus’s cloud-native flexibility, the right choice comes down to your environment’s scale, your team’s expertise, and how much operational overhead you can realistically absorb.
Here’s how the field breaks down:
- Zabbix is the best all-rounder for enterprise-scale Linux and network hybrid environments, offering agent-based and agentless coverage with built-in deep alerting logic.
- Netdata is your go-to for real-time, per-second troubleshooting, ideal when you need to diagnose a live incident, not trend data from yesterday.
- Nagios Core remains the proven choice for teams that prioritize long-term stability and a mature plugin ecosystem backed by decades of community support.
- Prometheus + Grafana leads for modern, container-native observability where custom metrics and dynamic dashboards are non-negotiable.
- Cost efficiency is real, but conditional. Open-source tools offer significant savings in large-scale Linux environments, especially stacked against per-host SaaS pricing. But that advantage only holds if your team has the capacity and expertise to configure, maintain, and scale them.
And that last point is where many IT leaders hit a wall. These tools are powerful. The hidden cost is the expertise required to keep them running reliably.
“The best monitoring tool is the one your team can actually operationalize without burning out the people behind it.”
Beyond Tools: When to Move to a Managed NOC
Free tools carry a hidden price tag. Between patching Prometheus exporters, tuning Zabbix thresholds, and triaging alert noise at 2 a.m., your team’s capacity quietly erodes. What started as a cost-saving choice becomes a staffing burden one that compounds every time your infrastructure grows.
That’s where a managed NOC partner changes the equation. Rather than handing you another dashboard to manage, a true operational partner follows your specific escalation playbooks, filters the noise, and intervenes before users feel the impact. As ExterNetworks puts it: we simplify network complexity by operating as an extension of our clients’ teams, not just another vendor.
The result is a fundamental shift from reactive firefighting to proactive infrastructure control. Your team can focus on strategic priorities while a dedicated NOC handles the overnight alerts, incident correlation, and SLA tracking that drain bandwidth.
- Audit your current alert volume: quantify the hours your team loses weekly to false positives and manual triage.
- Identify your coverage gaps: map which shifts, systems, or escalation paths have no reliable owner.
- Request an operational audit: let an expert team assess your infrastructure before you commit to more manual configuration.
“If your free tools are generating more work than they eliminate, it’s time to ask whether DIY monitoring is still the right strategy for the business you’re building.”
Related on ExterNetworks Right Now!