Table of Content
Downtime Draining Your Business?
Fix It Before It Costs More
Missed alerts turn into outages, outages turn into lost revenue. ExterNetworks Inc. delivers 24/7 NOC & Help Desk support to keep everything running smoothly.
Get 24/7 IT Support Now
What is Proactive Network Monitoring?
Network and security teams spend too much time responding to problems that were already visible in the data; they didn’t have a system watching for them. Proactive network monitoring changes that equation entirely. Instead of waiting for users to report an outage or tickets to pile up, it gives your team continuous network visibility across every device, link, and application before a small anomaly becomes a full-scale incident.
Here’s how it works in practice:
- Establish continuous visibility. Deploy monitoring agents and collectors across your infrastructure to capture real-time telemetry, traffic flows, device states, interface utilization, and latency around the clock.
- Track performance metrics. Measure the indicators that matter: packet loss, bandwidth consumption, CPU load on network devices, and response times. Performance monitoring surfaces the patterns that precede failure.
- Define baselines and thresholds. Use historical data to establish what “normal” looks like for your environment. Set thresholds that trigger alerts when behavior deviates, not after the damage is done.
- Detect anomalies and generate alerts. When a metric crosses a threshold or a behavior pattern shifts unexpectedly, the system flags it immediately. Research into proactive network monitoring frameworks confirms that early anomaly detection is the critical differentiator between a minor event and a service-impacting outage.
- Take preventive action. Alerts without action are noise. A disciplined, proactive approach means your team or your 24×7 NOC partner follows defined escalation playbooks to investigate and resolve issues before users notice.
- Optimize continuously. The workflow doesn’t stop at detection. Data from each event feeds back into your baselines, refining thresholds and improving future alert accuracy. It’s a discovery-to-optimization loop that gets sharper over time.
The contrast with reactive monitoring is stark. Reactive teams learn about problems from end users often long after the impact has spread. Proactive monitoring flips that dynamic: your infrastructure talks to you first, and you stay in control of the outcome.
That shift from firefighting to foresight is why proactive network monitoring has become a cornerstone of modern IT operations, and the sections ahead will show you exactly why it matters.
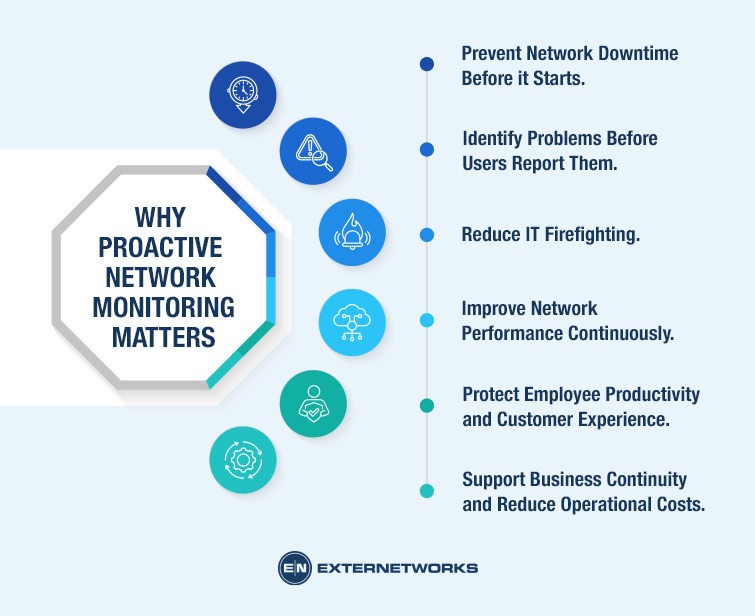
Why Proactive Network Monitoring Matters
Getting ahead of problems before they become outages isn’t just a nice-to-have; it’s the difference between a smooth operation and a crisis-driven workday. Here’s how to build the case for proactive monitoring across your network and infrastructure management, and what each benefit actually means in practice.
- Prevent network downtime before it starts. Reactive monitoring catches fires after they’ve spread. Proactive monitoring catches the smoke. By continuously tracking performance thresholds and behavioral patterns, you stop failures at the source before users ever notice.
- Identify problems before users report them. When your team hears about an outage from a frustrated end user, you’ve already lost time. A proactive approach surfaces anomalies in real time, so your engineers act on data, not complaints. This is the core principle behind network observability, which goes deeper than simple alerting.
- Reduce IT firefighting. Alert fatigue is real. When your team spends every shift reacting to cascading incidents, strategic work stalls. Proactive monitoring filters signal from noise, so your people spend time on meaningful work instead of chasing the same recurring issues.
- Improve network performance continuously. Monitoring trends over time exposes chronic bottlenecks that never trigger a hard outage but quietly degrade throughput and latency. You can’t optimize what you can’t measure.
- Protect employee productivity and customer experience. Slow networks hurt both groups simultaneously. Internal users lose hours to lag and dropped connections. Customers hit friction at checkout, login, or support, and some don’t come back. The cost of poor network performance compounds fast.
- Support business continuity and reduce operational costs. Unplanned downtime is expensive. Managed NOC services shift your operational model from reactive and unpredictable to proactive and cost-controlled, turning infrastructure risk into a manageable, measurable line item.
Each of these benefits depends on knowing what to monitor and where to look. That’s exactly where we’re headed next.
What Should You Monitor Proactively?
Knowing that you need proactive network monitoring is one thing. Knowing what to watch is where the real operational leverage lives. A well-configured network monitoring server setup doesn’t just ping devices; it tracks the right signals across every layer of your infrastructure so problems surface before users notice them.
Here’s how to build a complete monitoring scope:
- Monitor network availability end-to-end. Track uptime across every router, switch, firewall, and critical link. Availability monitoring confirms that devices are reachable and that traffic paths are intact; it’s your most foundational health signal.
- Measure latency, packet loss, and jitter continuously. These three metrics reveal degradation long before an outage hits. A spike in latency or a packet loss rate above 1% often signals congestion, hardware issues, or upstream provider problems you can address proactively.
- Track bandwidth and throughput across key segments. Saturated links cause slowdowns that feel like outages to end users. Monitoring utilization trends lets you right-size capacity before a bottleneck forms, not after a call comes in.
- Assess device health: CPU, memory, and interface errors. A router running at 95% CPU is a ticking clock. Polling device-level metrics on a regular cycle catches hardware strain early, which is exactly the kind of signal that separates a managed infrastructure from a reactive one. Our around-the-clock monitoring teams are built to act on these signals before they escalate.
- Watch DNS, DHCP, and VPN service health. These foundational services are frequently overlooked, but when DNS resolution slows or a VPN tunnel drops, productivity grinds to a halt fast. Monitoring response times and failure rates here pays dividends in business continuity.
- Extend visibility to wireless and cloud performance. Modern infrastructure doesn’t stop at the firewall. Access point signal quality, cloud service latency, and SaaS application response times all belong in your monitoring scope if they affect your users.
Together, these six monitoring layers give you the visibility to move from reactive firefighting to genuine network observability. Once you know what to watch, the next challenge is interpreting what those signals mean, which brings us to the early warning signs that matter most.
Early Warning Signs of Network Problems
Effective network server monitoring solutions start with knowing what to look for before an alert fires. The signals that precede outages are often subtle: a slight uptick in latency here, an interface error count climbing there. Catch them early, and you contain the problem. Miss them, and you’re managing a crisis.
Here’s how to recognize the warning signs that matter most:
- Watch for latency creep and packet loss. Gradually rising round-trip times and any measurable packet loss are among the earliest indicators that a link is saturating or a device is struggling. Even a 1-2% packet loss rate can significantly degrade real-time applications like VoIP and video conferencing.
- Track CPU and memory spikes on critical devices. Sustained CPU utilization above 80% on routers or switches signals that a device is approaching its processing ceiling, a state that often precedes dropped connections or full failures.
- Monitor interface error counters. CRC errors, input/output drops, and interface resets rarely appear by accident. A rising error count on a specific interface points toward a bad cable, a duplex mismatch, or failing hardware.
- Check device temperatures. Thermal spikes in server rooms or network closets frequently precede hardware failures. Overheating is a preventable cause of downtime that’s easy to overlook without consistent environmental monitoring.
- Identify DNS instability. Slow or failing DNS resolution causes applications to time out, users to report connectivity issues, and misdiagnoses of the root cause. Unusual query failure rates are a reliable early signal.
- Flag VPN tunnel instability. Frequent tunnel drops or renegotiation events disrupt remote workers and branch connectivity. Tracking tunnel uptime and authentication failures surfaces problems before users escalate tickets.
Recognizing these signals is one part of the equation. The other and frankly harder part is building a system that collects, correlates, and acts on them consistently. That’s where proactive monitoring mechanics come into play.
How Proactive Network Monitoring Works
Understanding the warning signs is only half the equation. The other half is building a disciplined, repeatable process that catches those signs early and acts on them fast. Here’s how a well-structured proactive network monitoring workflow actually runs from the ground up.
- Discover and inventory your environment. Before you can monitor anything, you need a complete picture of what’s running. Map every device, interface, server, and application across your infrastructure. Undiscovered assets are unmonitored risks, and they’re more common than most teams realize.
- Collect telemetry continuously. Once you define your inventory, every device starts feeding data back to your monitoring platform. The right network monitoring protocol, whether SNMP, ICMP, syslog, or NetFlow, determines what data you capture and how accurately it reflects real-time conditions. More on those specifics in the next section.
- Establish performance baselines. Raw telemetry is noise without context. Analyze historical data to define what “normal” looks like for your network: typical bandwidth consumption, average CPU load, and expected latency ranges. These baselines become your reference point for everything that follows.
- Set intelligent thresholds and trigger alerts. Apply dynamic thresholds against your baselines so alerts fire when behavior deviates meaningfully, not just when a static number is crossed. This reduces alert fatigue while catching genuine anomalies before they escalate into outages. Teams using 24/7 managed monitoring coverage typically resolve issues at this stage, well before users are affected.
- Run automated anomaly detection. AIOps-driven monitoring layers pattern recognition across your telemetry stream, flagging irregular behavior that rule-based thresholds might miss. A sudden shift in traffic flow at 2:00 a.m., for example, could signal a misconfiguration or a security event, not just a busy period.
- Execute root-cause analysis and remediation. When an alert fires, the goal isn’t just acknowledgment; it’s resolution. Correlate alerts across devices, trace the fault to its origin, and apply a fix. Document the incident. Feed that data back into your baselines and detection logic so your system improves with every event.
Each step builds directly on the last. The effectiveness of the entire process depends heavily on the protocols and technologies you use to collect and interpret that telemetry, which is exactly where we’re headed next.
Technologies Used in Proactive Network Monitoring
The right network monitoring protocols and practices form the backbone of any proactive strategy. Understanding what each technology does and when to use it helps you build a monitoring stack that catches problems at every layer of your infrastructure.
Each tool below serves a distinct purpose. Together, these tools give you the full-spectrum visibility needed to shift from reactive firefighting to predictable, stable operations.
- Deploy SNMP, ICMP, and Syslog for foundational visibility. SNMP polls devices for performance counters like CPU load, memory usage, and interface errors. ICMP confirms reachability through simple ping tests. Syslog collects event logs from routers, firewalls, and switches, surfacing configuration changes and fault messages before they escalate.
- Enable NetFlow, IPFIX, or sFlow for traffic intelligence. These protocols capture flow-level data on who’s talking to whom, on which port, and how much. They’re essential for detecting bandwidth abuse, unusual east-west traffic, and early signs of congestion that raw uptime checks miss entirely.
- Integrate APIs and streaming telemetry for real-time accuracy. Modern network devices push telemetry data continuously rather than waiting to be polled. This dramatically reduces detection latency and feeds AIOps platforms with the granular, time-series data needed for anomaly detection and predictive alerting.
- Add synthetic monitoring to validate the user experience. Synthetic tests simulate real transactions, login flows, DNS lookups, and application response times from controlled probes. They catch degradation that infrastructure metrics alone won’t reveal, particularly for remote users and SaaS-dependent workflows.
No single protocol tells the complete story. But layered together, these technologies build the network observability foundation that modern IT environments demand a point that becomes even more critical when you’re managing multiple environments simultaneously.
Proactive Network Monitoring Across Modern IT Environments
Proactive network monitoring doesn’t operate in a single, tidy environment. Today’s IT infrastructure spans on-premises hardware, cloud platforms, remote workforces, and distributed sites, and each layer introduces its own visibility challenges. Here’s how to apply a consistent monitoring strategy across each environment so your network troubleshooting stays structured rather than reactive.
- Establish a unified baseline across on-premises and cloud. Map every asset physical servers, virtual machines, and cloud instances and define normal performance thresholds for each. Without a shared baseline, anomalies in one layer often go undetected until they cascade into the next.
- Extend visibility into hybrid and multi-site architectures. Deploy lightweight monitoring agents at each site to capture local latency, packet loss, and link health. Centralize that data into a single dashboard so your team sees the full picture, not isolated fragments.
- Monitor remote users and wireless endpoints separately. Remote connections and Wi-Fi introduce variables that wired infrastructure doesn’t. Track VPN tunnel stability, wireless signal quality, and application response times specific to remote sessions. Issues here often surface as user complaints before they appear in dashboards.
- Instrument SD-WAN paths and data center interconnects. SD-WAN environments route traffic dynamically, which makes manual network troubleshooting especially difficult. Automate path performance checks and set alerts for routing changes that fall outside expected parameters.
- Normalize and correlate telemetry from all environments. Raw data from disparate sources creates noise. Feed metrics into a centralized platform that normalizes formats and correlates events across layers, so a spike in cloud latency and a simultaneous on-premises switch alert are treated as a related pattern, not two unconnected tickets.
- Review coverage gaps on a regular cadence. Infrastructure evolves fast. Schedule quarterly audits to identify newly added cloud services, remote sites, or network segments that have drifted outside your monitoring scope.
With consistent coverage across every environment, your monitoring strategy stops being a patchwork of disconnected tools and becomes a reliable early-warning system. And that foundation matters beyond performance alone; it also makes your infrastructure defensible from a security standpoint, which is exactly where we’ll go next.
Proactive Network Monitoring and Security
Security isn’t a separate discipline from network performance; it’s woven directly into it. This guide walks you through using network monitoring tools and strategies to detect and respond to security threats before they escalate into outages, breaches, or compliance failures.
- Detect abnormal traffic patterns early. Configure your monitoring platform to establish baseline traffic behavior for each network segment. Sudden spikes in outbound data, unexpected protocol usage, or unusual port activity often signal a compromise. Automatically flag deviations so your team doesn’t have to hunt through raw logs.
- Identify unauthorized devices on the network. Run continuous device discovery scans against your known asset inventory. Any unrecognized MAC address or rogue endpoint that appears on your network should trigger an immediate alert. In unmonitored environments, unauthorized devices often persist for weeks before anyone notices.
- Monitor for configuration drift. Routers, switches, and firewalls can be quietly altered either through human error or malicious intent. Compare running configurations against approved baselines on a scheduled and event-driven basis. Even a small ACL change can open a significant vulnerability.
- Track firewall health and rule integrity. A firewall that’s up but misconfigured offers a false sense of security. Monitor rule sets for conflicts, expired entries, and policy violations. Verify that traffic is being filtered as expected, not just that the appliance shows a green status.
- Spot DDoS indicators before saturation hits. Watch for the early signatures of a distributed denial-of-service attack: rising ICMP flood rates, SYN packet anomalies, and sudden bandwidth consumption from geographically dispersed sources. Early detection gives your team time to activate mitigation instead of reacting to a full outage.
- Integrate with SIEM and SOC workflows. Feed your monitoring data into a Security Information and Event Management (SIEM) platform and align escalation paths with your SOC team. Correlate network events, log data, and endpoint telemetry to turn isolated alerts into actionable threat intelligence.
When security and network observability operate from a unified data stream, your team catches threats that would otherwise stay invisible until they cause real damage. That same visibility across traffic patterns, device behavior, and infrastructure health drives smarter decisions about resource utilization and future capacity needs.
Proactive Network Monitoring for Capacity Planning
Effective network monitoring doesn’t just tell you what’s broken; it tells you what’s about to break. Capacity planning is where proactive monitoring shifts from operational defense to strategic offense. Here’s how to use your monitoring data to get ahead of resource constraints before they become outages.
- Collect and analyze bandwidth trend data. Pull historical traffic reports across your key links and segments. Look for consistent growth patterns, seasonal spikes, and time-of-day peaks. A common pattern is steady 15-20% quarterly bandwidth growth going unnoticed until a link saturates during peak hours.
- Set utilization thresholds for early saturation warnings. Configure alerts when CPU, memory, or link utilization crosses 70-80%, not 95%. By the time you hit the red zone, you’re already impacting performance. Earlier thresholds give your team time to react before users feel the pain.
- Map infrastructure utilization across every tier. Track servers, switches, firewalls, and WAN links as a connected system. A saturated core switch creates bottlenecks that look like application slowness; without full-stack visibility, you won’t diagnose it correctly.
- Build predictive models from trend data. Use your historical metrics to project when specific resources will hit capacity. In practice, teams that model 90-day forward utilization can schedule upgrades during planned maintenance windows rather than scrambling during incidents.
- Document and prioritize upgrade timelines. Translate your capacity forecasts into a prioritized infrastructure roadmap. Align upgrade timing with budget cycles and business-critical periods so procurement never catches your team off guard.
- Review capacity reports on a regular cadence. Schedule monthly or quarterly capacity reviews with stakeholders. Monitoring data only drives decisions when it reaches the people with authority to act on it.
Done right, capacity planning converts your monitoring platform into a business planning tool one that reduces unplanned downtime and removes the scramble from infrastructure growth. With the data foundation in place, the next step is applying structured best practices that keep your entire monitoring operation sharp and consistent.
Proactive Network Monitoring Best Practices
Knowing what to monitor is only half the equation. How you structure your monitoring practice determines whether you’re genuinely ahead of problems or just generating noise. Here’s how to build a disciplined approach to network performance monitoring tools that actually moves the needle.
- Prioritize critical infrastructure first. Not every device or service carries equal business weight. Map your monitoring coverage to business impact. Core routers, firewalls, authentication systems, and customer-facing applications deserve the highest polling frequency and the tightest alert thresholds. Secondary systems can follow a tiered model. This prioritization ensures your team’s attention lands where downtime costs the most.
- Establish meaningful baselines before you set thresholds. A CPU spike to 80% might be normal for a database server during a nightly backup, or it might signal a serious problem at 2:00 p.m. on a Tuesday. Without a documented baseline, you can’t tell the difference. Collect at least two to four weeks of performance data before locking in thresholds. In practice, revisit baselines quarterly as traffic patterns and workloads evolve.
- Configure alerting to signal actionable problems, not every anomaly. Meaningful alerting reduces noise rather than maximizing coverage. Alerts should trigger only when a condition requires human judgment or intervention. Group related alerts, suppress known maintenance windows, and route notifications to the right team based on severity. The goal is a clean signal your on-call engineer can trust.
- Monitor the user experience, not just the wire. Interface-level latency doesn’t always reflect what an end user actually experiences. Incorporate synthetic transaction monitoring and endpoint response time checks to understand how applications perform from the user’s perspective. Network observability means tracking the full path from the data center to the desktop.
- Integrate your monitoring stack with ITSM workflows. Monitoring data siloed from your ticketing system creates friction. When an alert fires, it should automatically generate a prioritized incident ticket, link to relevant topology data, and trigger the correct escalation path. ITSM integration tightens the feedback loop between detection and resolution, cutting mean time to repair.
- Apply automation to repetitive response tasks. AIOps and rule-based automation can handle a significant volume of low-level remediation, restarting services, clearing log queues, rerouting traffic without human intervention. Reserve your engineers for decisions that genuinely require judgment. Automation doesn’t replace your team; it protects their capacity for higher-value work.
Even with these practices in place, execution gaps are surprisingly common. The next section covers the most frequent proactive monitoring mistakes and why even well-intentioned teams fall into them.
Common Proactive Monitoring Mistakes
Even well-resourced IT teams fall into patterns that quietly erode their monitoring effectiveness. Understanding these pitfalls matters as much as implementing the right tools, because a misconfigured monitoring practice can create more noise than clarity.
Here’s how to avoid the most common traps:
- Stop monitoring everything equally. Without prioritization, your team treats a minor switch blip the same as a core router failure. Map your monitoring coverage to business impact first; protect revenue-critical systems with tighter thresholds and faster escalation paths.
- Tune your alerts to eliminate noise. Alert fatigue is one of the most damaging problems in IT operations. When every event triggers a notification, responders start ignoring them, and real incidents get missed. Set alert policies that surface actionable signals, not raw volume.
- Calibrate your thresholds against real baselines. Poorly configured thresholds set too low or copied from defaults generate constant false positives. Use historical performance data to define what “normal” actually looks like for your environment before locking in any threshold.
- Account for cloud dependencies explicitly. On-premises infrastructure monitoring won’t capture failures in cloud services, SaaS platforms, or hybrid connectivity paths. If your applications depend on external providers, you need visibility into those dependencies too.
- Expand your scope beyond uptime. Focusing only on whether a device is “up” misses latency spikes, packet loss, and degraded throughput conditions that hurt users long before a system goes fully offline. Incorporate network anomaly detection systems to catch these subtle deviations early.
- Revisit your monitoring configuration regularly. Infrastructure changes. New services get added, traffic patterns shift, and old thresholds become irrelevant. Schedule periodic reviews to keep your monitoring practice aligned with your actual environment.
A monitoring setup that checks boxes without delivering operational clarity isn’t a safety net; it’s a liability. Fixing these mistakes moves you from reactive alert-chasing toward genuine, predictable infrastructure control. And as your practice matures, it raises a deeper question: is monitoring alone enough, or does your team need the broader context that network observability provides?
Proactive Network Monitoring vs. Network Observability
You’ve now covered what to monitor and how to structure your practice effectively. But one term is gaining serious traction in IT infrastructure circles and is worth unpacking: network observability. Understanding how it differs from traditional proactive network monitoring helps you make smarter decisions about your overall strategy.
Here’s how to build a clear mental model and apply it practically:
- Define observability correctly. Observability is the ability to understand your infrastructure’s internal state by examining its external outputs. While monitoring tells you something is wrong, observability helps you understand why, giving you deeper diagnostic context beyond an alert.
- Recognize where monitoring ends and observability begins. Traditional monitoring of network devices effectively tracks known metrics against defined thresholds. Observability extends that capability by capturing unpredictable, complex failure patterns that pre-set rules can’t anticipate. Think of monitoring as your early warning system and observability as your investigative toolkit.
- Integrate the three data pillars: metrics, logs, and traces. Monitoring typically relies on metrics alone: CPU load, bandwidth, latency. Observability layers in logs (event records), network flows (traffic path data), and traces (end-to-end request journeys). Together, these data types create a far richer picture of network performance and health.
- Prioritize correlation across data sources. Isolated metrics rarely tell the full story. Correlating a spike in error logs with a specific traffic flow and a degraded trace path is where real diagnostic power lives. Without correlation, you’re managing noise, not insight.
- Apply correlation to reduce mean time to resolution (MTTR). When correlated data surfaces a root cause faster, your team spends less time guessing and more time resolving. That directly protects uptime and reduces the business risk tied to network downtime.
- Treat observability as the evolution of monitoring, not a replacement. You still need structured monitoring as your foundation. Observability builds on it by adding context, depth, and the analytical capability to handle increasingly complex infrastructure environments.
This layered approach to understanding your network sets the stage for what comes next. And as data volumes grow and infrastructure complexity accelerates, manual correlation alone won’t scale, which is exactly where AI and predictive capabilities are changing the game.
AI and Predictive Network Monitoring
Traditional threshold-based alerting tells you when something has already gone wrong. AI and predictive network monitoring shift that equation entirely, surfacing problems before they become outages, and giving your team time to act rather than react.
Here’s how to put these capabilities to work in your monitoring practice:
- Deploy machine learning anomaly detection. Rather than relying solely on static thresholds, train ML models on your historical traffic, latency, and error-rate data. These models establish a dynamic baseline and flag deviations that wouldn’t trigger conventional alerts, such as a gradual memory leak or a subtle uptick in packet loss that precedes a failure event.
- Enable predictive failure detection. Analyze time-series data from switches, routers, and servers to identify patterns that historically precede hardware or link failures. In practice, a degraded optical transceiver or an overheating chassis will show measurable signals days before it drops your network. Catching those signals early is the difference between a planned maintenance window and an unplanned outage.
- Integrate AIOps into your monitoring stack. AIOps platforms correlate alerts across your entire infrastructure, suppress noise, and surface only the events that matter. Instead of a team drowning in thousands of alerts, AIOps delivers a prioritized, contextualized view of what’s at risk, dramatically reducing mean time to detect (MTTD) and the operational burden on your engineers.
- Apply predictive capacity planning. Use trend analysis and forecasting models to project when a circuit, storage volume, or compute resource will hit saturation. This lets you provision ahead of demand rather than scrambling when network performance starts degrading under load a particularly critical capability for teams managing seasonal traffic spikes or rapid infrastructure growth.
- Automate root-cause analysis (RCA). When an incident does occur, AI-assisted RCA tools trace the causal chain across logs, metrics, and topology data in seconds. What might take an engineer two hours to piece together manually can surface in minutes, accelerating resolution and reducing the risk of misdiagnosis that leads to repeat incidents.
The research published in ScienceDirect on proactive computer network monitoring underscores what practitioners are finding in the field: machine learning approaches consistently outperform rule-based systems at identifying infrastructure risk before it materializes.
These AI-driven capabilities don’t replace your team; they make your team faster and more precise. And they lay the groundwork for the kind of implementation that actually sticks. Next, we’ll walk through a practical, step-by-step framework for standing up proactive network monitoring in your environment.
How to Implement Proactive Network Monitoring
Getting proactive network monitoring off the ground isn’t just about deploying a tool and hoping for the best. It requires a structured approach one that aligns your monitoring practice with business objectives, reduces alert noise, and integrates cleanly into your existing workflows. Here’s a practical framework to get you there.
- Inventory your entire infrastructure. Before you can monitor anything effectively, you need a complete picture of what exists. Document every device, server, application, and network segment. Gaps in your inventory are gaps in your visibility, and those gaps are where outages hide.
- Define your monitoring objectives. Identify what “healthy” looks like for your environment. Are you optimizing for uptime, latency thresholds, or SLA compliance? Tying your objectives to business outcomes keeps your monitoring practice focused, not sprawling.
- Select the right metrics for your environment. Not every metric matters equally. Prioritize the signals most likely to indicate degradation before it becomes downtime; bandwidth utilization, CPU load trends, error rates, and interface health are strong starting points. Align metric selection with the observability principles covered earlier in this guide.
- Configure thresholds and alert policies deliberately. Set thresholds based on historical baselines, not arbitrary defaults. Proactive monitoring best practices emphasize tuning alert sensitivity carefully: too low and you’re drowning in noise; too high and real issues slip through undetected.
- Integrate monitoring with your ITSM platform. Connect your monitoring stack to your incident management workflows so that alerts automatically generate tickets, trigger escalation paths, and route to the right team. Without this integration, even the best alerting becomes a manual bottleneck.
- Establish escalation tiers and ownership. Define clearly who responds to which alert type and within what timeframe. Ambiguity during an incident costs you recovery time. Assign ownership at each escalation tier before an event, not during one.
- Automate remediation for known issue patterns. Common, well-understood issues interface resets, service restarts, log rotation failures shouldn’t require human intervention every time. Build runbooks and automate responses where the resolution is predictable and low-risk.
- Continuously tune and optimize your alert rules. A monitoring configuration that works today may not work in six months. Review false-positive rates regularly and adjust thresholds as your infrastructure evolves. This is an ongoing operational discipline, not a one-time setup task.
- Build visibility dashboards for different stakeholders. IT engineers need granular technical data. Business leaders need operational health summaries. Design your reporting layer so each audience sees what’s relevant without requiring translation from your team every time.
- Review and iterate on a scheduled cadence. Schedule formal operational reviews at least monthly to assess whether your monitoring practice is achieving its defined objectives. Track trend data, review incident patterns, and adjust your approach based on evidence.
Following this framework gives your team the structure needed to shift from reactive firefighting to genuine operational confidence. But knowing how to implement monitoring is only part of the picture; you also need to know whether it’s working. That brings us to the metrics that show whether your proactive monitoring practice is delivering results.
How to Measure Proactive Network Monitoring
Deploying proactive network monitoring is only half the equation. You also need to know whether it’s actually working. These five metrics give you a clear, measurable picture of your monitoring program’s effectiveness and where it still needs refinement.
- Track uptime, latency, packet loss, and jitter continuously. These are your baseline network performance indicators. Uptime tells you availability; latency, packet loss, and jitter reveal the quality of that availability. Degraded jitter or rising packet loss often signals an emerging problem before users ever notice.
- Measure Mean Time to Acknowledge (MTTA) and Mean Time to Resolve (MTTR). MTTA reflects how quickly your team detects and acknowledges an incident. MTTR shows how fast it’s resolved. Both should trend downward over time; if they don’t, your monitoring program isn’t delivering the proactive value it should.
- Monitor incident frequency over time. A well-tuned proactive monitoring program reduces recurring incidents. Track incident counts month over month. Flat or rising numbers often point to unresolved root causes or gaps in your detection coverage.
- Report on SLA compliance. Whether you’re managing internal service commitments or customer-facing SLAs, compliance rates directly reflect your network’s operational health. Missed SLAs translate to business risk, and they’re measurable proof that your monitoring approach needs adjustment.
- Audit your false-positive rate. Alert noise is the enemy of effective monitoring. A high false-positive rate burns out your team and masks real threats. Tracking and reducing false positives is a key signal that your network observability and alerting logic are maturing in the right direction.
Consistently reviewing these metrics turns your monitoring program from a reactive safety net into a data-driven operational asset. And once you have this measurement foundation in place, the next logical question becomes: who should own it? That’s where the case for managed network monitoring becomes compelling.
How Should Organizations Test Whether Their Monitoring System Can Detect Outages?
Organizations should regularly test their monitoring systems to verify that they detect and report outages, performance degradation, and service failures within defined response targets. Testing should cover the entire process, from detecting an issue to delivering alerts, escalating incidents, and confirming resolution.
Conduct controlled failure simulations: In a test environment or approved maintenance window, simulate failures such as a server becoming unavailable, a network link going down, excessive latency, or a critical service stopping. Verify that monitoring tools detect each condition without disrupting production systems.
Test alert delivery: Trigger test alerts and confirm they reach the correct teams through configured channels, such as email, SMS, mobile notifications, or incident management platforms. Check for delivery delays, missing notifications, duplicate alerts, and incorrect severity levels.
Use synthetic transactions: Run automated tests that simulate real user activities, such as logging in, loading a website, querying an API, or completing a transaction. Confirm that monitoring identifies failed transactions, slow responses, and service availability issues that infrastructure checks alone might miss.
Conduct escalation drills: Simulate an unacknowledged critical alert and verify that it escalates to the next responder or on-call team according to the escalation policy. Check acknowledgment deadlines, notification routing, and incident ownership.
Verify detection and response times: Measure the time from the start of a simulated failure to detection, alert delivery, acknowledgment, and escalation. Compare these results with defined targets for mean time to detect (MTTD), alert response time, and service-level agreements (SLAs).
Document results and close gaps: Record missed alerts, false positives, delayed notifications, and monitoring blind spots. Update thresholds, dependencies, runbooks, and escalation rules, then repeat the tests to confirm that the issues are resolved.
Organizations should schedule these tests periodically and after significant infrastructure changes, monitoring-platform upgrades, or changes to alerting policies. Production tests should follow approved change procedures, include clear rollback plans, and use safeguards to prevent unintended outages.
The goal is to validate the complete detection-to-escalation workflow, not simply confirm that monitoring dashboards are operational.
Does Proactive Network Monitoring Guarantee Zero Downtime?
No, proactive network monitoring cannot guarantee zero downtime. It helps organizations reduce outage risks by identifying performance issues, detecting unusual network behavior, and alerting IT teams to potential failures before they escalate. Early detection can shorten response times, minimize service disruptions, and improve network availability.
However, hardware failures, internet service provider outages, power interruptions, software bugs, cyberattacks, and unforeseen events can still cause downtime, even when monitoring systems are operating correctly. Organizations should combine proactive monitoring with network redundancy, automated failover, regular maintenance, disaster recovery planning, and clearly defined incident response procedures to improve resilience and maintain realistic uptime targets.
When Should You Consider Managed Network Monitoring?
You’ve now seen how to implement and measure proactive network monitoring. But a harder question lies beneath it all: should your team run this in-house at all?
For many IT leaders, the honest answer is no. Here’s how to recognize when it’s time to bring in a managed partner.
- Identify your staffing gaps. If your team lacks dedicated network specialists, generalists end up triaging alerts while already stretched thin. In practice, this means slower mean time to detect and incidents that escalate further than they should.
- Assess your coverage hours. Network problems don’t observe business hours. If your infrastructure has 24/7 uptime requirements but your monitoring coverage doesn’t match that window, you have a structural risk, not just an inconvenience.
- Map your infrastructure complexity. Hybrid environments, multi-cloud deployments, and distributed edge locations each add monitoring surface area. When the complexity of your network observability requirements outpaces your internal tooling and expertise, managed support closes that gap.
- Measure your team’s reactive load. Count how many hours per week your IT staff spend chasing alerts rather than executing on strategic projects. If that number is high, alert fatigue is already eroding both performance and morale.
- Calculate the cost of downtime against the cost of managed coverage. A single unplanned outage can cost thousands of dollars per minute in lost productivity and revenue. Managed network monitoring shifts that risk from reactive crisis response to proactive prevention with measurable reporting to back it up.
- Evaluate fit with a Managed NOC partner. A specialized partner extends your team, not replaces it. Look for providers who offer transparent escalation paths, operational dashboards, and incident response metrics, not just generic uptime claims.
If several of these scenarios sound familiar, managed network monitoring isn’t overhead; it’s the infrastructure strategy that lets your team focus on growth. Still have questions about how this works in practice? The FAQs below cover the most common ones.
These answers address the questions IT leaders and MSP owners ask most often before committing to a proactive network monitoring strategy.
Proactive network monitoring is the practice of continuously monitoring network performance, traffic patterns, and device health to detect and resolve issues before they cause downtime or impact users. Instead of reacting to outages after the fact, your team or a managed partner identifies warning signs early and acts on them.
Reactive monitoring alerts you when something has already broken. Proactive monitoring uses baselining, threshold analysis, and anomaly detection to catch degradation trends while there’s still time to intervene. The difference isn’t just technical; it’s the difference between a 3 a.m. emergency call and a Tuesday morning maintenance window.
The most measurable benefits include reduced mean time to detect (MTTD), fewer customer-facing outages, lower incident response costs, and reclaimed focus for your internal team. You’re not just protecting uptime; you’re protecting revenue, reputation, and staff morale.
Common tools span network performance monitors, SNMP-based polling platforms, flow analyzers, log aggregators, and AIOps platforms that correlate signals across your entire infrastructure. The right stack depends on your environment’s complexity, not the longest feature list.
Yes. Anomalous traffic patterns, sudden bandwidth spikes, unusual lateral movement, and unexpected port activity are often early indicators of a breach or ransomware event. Proactive monitoring creates a layer of operational visibility that complements your security tooling.
Modern proactive monitoring extends beyond on-premises hardware to cover cloud workloads, virtual instances, and hybrid connectivity paths. Network observability tools aggregate telemetry across these environments, giving you a unified view rather than isolated silos.
Monitoring tells you that something is wrong. Observability helps you understand why by correlating metrics, logs, and traces across distributed systems. Proactive monitoring at scale increasingly depends on observability principles to make sense of complex, multi-cloud infrastructure.
Outsourcing to a managed NOC partner makes sense when your team is stretched thin, you lack overnight coverage, or alert volume overwhelms internal capacity. A specialized partner follows your escalation playbooks and operates as an extension of your team, not a replacement.
Track MTTD, mean time to resolve (MTTR), the ratio of proactive to reactive incidents, alert-to-ticket conversion rates, and SLA adherence over time. Improvement in these metrics signals that your monitoring posture is genuinely shifting from reactive to proactive.
Absolutely, and arguably more critical for them. Smaller teams can’t afford the productivity loss from unplanned outages or all-hands incident responses. Whether you build internal capability or partner with a managed NOC, proactive monitoring multiplies your team’s effectiveness without multiplying headcount.
Proactive network monitoring isn’t a tool you deploy; it’s an operational posture you build. And you don’t have to build it alone. If your team is ready to stop chasing alerts and start preventing outages, talk to an expert at ExterNetworks to see how a managed NOC partnership fits your environment.