Editor’s Note: Network performance monitoring is essential to track latency, packet loss, throughput, and availability metrics, helping organizations maintain optimal network health and user experience. This article... Read More

Missed alerts turn into outages, outages turn into lost revenue. ExterNetworks Inc. delivers 24/7 NOC & Help Desk support to keep everything running smoothly.
Get 24/7 IT Support NowNetwork performance monitoring is no longer an IT housekeeping task; it’s the operational foundation that separates enterprises that react to outages from those that prevent them entirely.
Your network is your business’s circulatory system. When it underperforms, everything downstream suffers: applications slow, transactions stall, and customer trust erodes in ways that don’t always show up in a ticket. Network performance monitoring (NPM) is the disciplined practice of visualizing, measuring, and optimizing network traffic to ensure that infrastructure behavior aligns with business expectations, not just minimum uptime thresholds.
Legacy monitoring tools were built for a simpler era. They watched for device failures, sent an alert when something went down, and waited for a technician to respond. In today’s distributed, hybrid, and cloud-connected environments, that reactive posture isn’t a safety net; it’s a liability. Modern infrastructure observability shifts the model entirely, giving operations teams the ability to understand why a system behaves the way it does, not just whether it’s technically online.
Uptime, frankly, is the baseline. Every enterprise expects their network to be available. But performance is the competitive differentiator the difference between a 50ms response time that delights a customer and a 400ms delay that sends them to a competitor. Organizations that treat performance as a strategic metric, rather than a technical afterthought, consistently outperform those that don’t.
The industry is moving decisively in this direction. Many professionals anticipate a shift to network intelligence in the near future, recognizing that raw metrics aren’t enough. Network intelligence means correlating performance data with business outcomes, predicting degradation before it impacts users, and making your NOC team proactive rather than reactive.
Before you can build that intelligence layer, you need a firm command of the core terminology that makes it possible.
Before you can act on network data, you need a shared language because imprecise terminology in infrastructure management leads to imprecise decisions.
The discipline spans several overlapping domains, and conflating them creates blind spots. Here’s a clear breakdown of the foundational terms that underpin everything covered in this guide:
NPM (Network Performance Monitoring)
The continuous measurement and analysis of network traffic, device health, and connectivity to ensure infrastructure operates within expected parameters. Tools like SolarWinds NPM exemplify this category, providing visibility into device states, traffic flows, and fault conditions across the environment.
A layer above NPM, APM tracks how the network affects the end-user software experience, measuring response times, transaction paths, and error rates at the application level. Understanding how APM intersects with network health is critical, because a slow app isn’t always a broken app; it’s often a congested network in disguise.
Observability
The ability to infer a system’s internal state from its external outputs: logs, metrics, and traces. Observability goes beyond simple monitoring; it asks not just “is something broken?” but “why is it broken, and where?”
Latency measures the delay in data traveling from point A to point B; throughput measures the volume of data successfully transferred over a period. Both matter, but they fail in different ways and require different remediation strategies.
The percentage of data packets that don’t reach their destination. Packet loss is a primary indicator of network congestion, hardware failure, or misconfiguration, and even a small percentage can severely degrade VoIP quality and real-time application performance.
Getting these definitions straight sets the stage for what matters most: knowing which metrics to measure and what they’re telling you about your infrastructure’s actual health. The next section covers that.
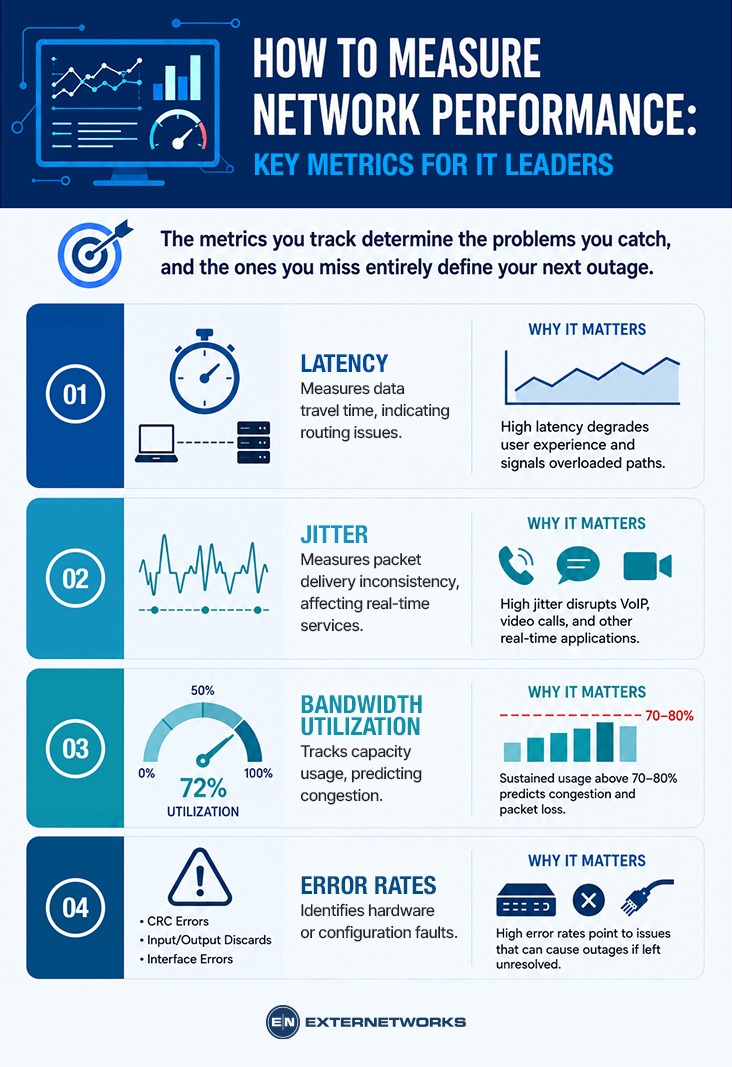
The metrics you track determine the problems you catch, and the ones you miss entirely define your next outage.
Network performance is typically measured through a combination of active testing and passive monitoring of real traffic, which means your measurement strategy needs to be as deliberate as your infrastructure design. Understanding which metrics carry real business weight separates reactive firefighting from proactive control. Here are the four you can’t afford to deprioritize:
These four metrics form the diagnostic foundation of any effective monitoring program. But knowing what to measure is only half the equation; you also need to understand how that data gets collected. The methodology behind capturing and inspecting network data is what gives these numbers their operational meaning.
How network performance monitoring tools collect data determines what problems you can actually find and how fast you can fix them.
Not all data collection methods reveal the same story. Each methodology offers a different lens on your infrastructure, and the strongest observability strategies layer multiple approaches together. Understanding how these methods work isn’t just academic; it directly shapes your ability to detect issues before they become outages.
SNMP (Simple Network Management Protocol) remains the industry standard for device health visibility. It polls routers, switches, firewalls, and servers at regular intervals, pulling metrics like CPU load, memory utilization, interface errors, and uptime status. Most network devices ship with SNMP support built in, making it a low-friction starting point for any monitoring deployment. However, SNMP’s polling intervals mean it can miss brief, high-impact events that spike and recover between cycles, a limitation worth keeping in mind when you’re designing your collection strategy.
Flow Data (NetFlow, sFlow, IPFIX) shifts the focus from device health to traffic behavior. Rather than asking “how is this device performing?”, flow data asks “who is talking to whom, and how much?” It builds a picture of conversation pairs, application bandwidth consumption, and traffic volume trends over time. Flow-based monitoring provides high-level visibility into who is talking to whom, making it invaluable for capacity planning and detecting unusual traffic patterns that may signal a security event or misconfiguration.
Packet Capture (PCAP) goes deeper. Where flow data shows the outline, packet inspection reveals exactly what is being said: the full content of network conversations. This level of detail is powerful for root-cause identification, especially when you’re chasing an intermittent application slowdown that SNMP and flow data can’t explain. The trade-off is storage and processing cost, so PCAP is typically reserved for targeted investigations rather than always-on collection.
Synthetic monitoring takes a different angle entirely. Instead of observing real traffic, it simulates user transactions a login sequence, a page load, a database query and measures how your infrastructure responds. This proactive approach surfaces degradation before real users experience it. Teams managing distributed environments or SaaS-delivered applications rely on synthetic monitoring to validate performance from the end-user perspective, not just the network backbone.
Together, these four methodologies give you the full picture. A managed NOC team working across all four collection layers can correlate device-level anomalies with traffic shifts and application-layer symptoms, significantly compressing the time from alert to resolution. The question isn’t which method to use; it’s how to integrate them into a coherent observability stack. That integration challenge is exactly where tooling choices start to matter, and it’s what we’ll examine next.
The tools that defined enterprise network monitoring a decade ago now struggle to deliver the full infrastructure observability that complex, hybrid environments demand.
SolarWinds NPM established the enterprise standard for node-based monitoring, giving IT teams a centralized view of device health, availability, and performance across multi-vendor environments. Its Observability Self-Hosted model became particularly attractive to security-conscious organizations that couldn’t route sensitive infrastructure data through external cloud platforms, and that preference hasn’t disappeared. For regulated industries like healthcare and finance, keeping monitoring data on-premises remains a non-negotiable requirement, not a legacy habit.
But here’s the challenge: as networks expanded across on-premises infrastructure, cloud workloads, and distributed edge locations, point solutions built around node polling began showing their limits. Data silos emerged as teams layered separate tools for flow analysis, application performance, and log management. Each tool generated its own alerts, dashboards, and view of the truth. When an incident occurred, engineers spent critical minutes, sometimes hours, correlating data across disconnected platforms rather than isolating the root cause and restoring service.
Multi-vendor support became another pressure point. Modern enterprise environments rarely run on a single hardware or software vendor. Switches, routers, firewalls, and wireless controllers often come from different manufacturers, each with its own MIBs, APIs, and telemetry formats. Tools that don’t normalize this data into a unified view force teams to context-switch constantly, increasing the risk of missed signals. That operational friction compounds alert fatigue and slows mean time to resolution.
Modern observability platforms address this by consolidating metrics, flow data, topology, and event correlation into a single operational picture. The evolution isn’t about abandoning proven tools; it’s about recognizing that isolated monitoring creates blind spots. As infrastructure grows more dynamic heading into 2026, what that unified picture needs to include is changing fast. Understanding how a managed NOC partner integrates across these tools can help IT leaders decide where to invest and where to extend their team’s capacity.
The infrastructure monitoring strategies that work today will buckle under the demands of 2026 hybrid environments, AI-driven workloads, and edge deployments, requiring a fundamentally different approach to network intelligence.
As previous sections have shown, modern NPM tools have already evolved beyond simple polling and threshold alerts. But infrastructure change is accelerating. Cloud-native architectures, SD-WAN fabrics, and SASE frameworks are pushing monitoring requirements into territory that legacy approaches weren’t designed to handle. Gartner identifies infrastructure monitoring tools as critical for managing the health of IT components across both on-premises and cloud deployments. That mandate only grows more complex as hybrid environments become the default.
Cloud-native and hybrid requirements demand monitoring that moves with your workloads. Static agents tied to physical devices can’t follow containerized applications spinning up across multi-cloud environments. What you need instead is observability that covers dynamic infrastructure, capturing telemetry from ephemeral resources without creating blind spots every time a workload migrates or scales.
The tools and architecture you choose now will directly shape your team’s ability to respond to incidents, control costs, and justify infrastructure investment, which is exactly where the business impact of proactive oversight becomes undeniable.
Proactive network oversight isn’t just an operational improvement; it directly protects revenue, strengthens security posture, and enables smarter capital allocation.
The difference between reactive and proactive IT isn’t measured in technical terms. It’s measured in hours of lost productivity, missed SLAs, and budget cycles where hardware spend is justified by gut feel rather than data. Proactive monitoring lets teams identify and resolve issues before they affect the end-user experience, and that shift carries real business weight.
| Dimension | Reactive IT | Proactive IT |
|---|---|---|
| Incident detection | Users report the problem | Automated alerting fires before users notice |
| MTTR | Hours of diagnosis under pressure | Minutes, with root-cause context already surfaced |
| Employee productivity | Work stops when the network slows | Degradation is caught and corrected before it spreads |
| Security posture | Breaches discovered post-incident | Anomalous lateral movement flagged in real time |
| Capacity planning | Reactive hardware purchases | Data-backed forecasts justify spend before bottlenecks hit |
Reduced MTTR is the most immediate win. Instant alerting compresses the time between a fault occurring and a technician acting on it. Without that visibility, your team is still triaging when customers are already churning.
Productivity impact is subtler but just as costly. “Slow is the new down” when applications lag, employees lose focus, workarounds multiply, and help desk volume spikes. Continuous performance baselines catch degradation early, before a slow afternoon becomes a full outage.
Security visibility is an underappreciated byproduct. Monitoring traffic patterns across your infrastructure surfaces unauthorized lateral movement the quiet, methodical behavior that precedes most breaches in time to contain it.
Capacity planning closes the loop. Historical performance data transforms hardware conversations from opinion into evidence, giving IT leaders defensible justification for infrastructure investment.
Organizations partnering with managed NOC services operationalize all four of these benefits continuously without adding headcount. But translating that capability into consistent outcomes means confronting some persistent challenges first.
The biggest obstacle in enterprise network monitoring isn’t the technology; it’s the operational noise, blind spots, and skill shortages that quietly erode your team’s ability to respond when it matters most.
These challenges don’t announce themselves. They accumulate, turning what should be a proactive discipline into a relentless cycle of reaction and recovery.
And this last point matters more than most IT leaders initially expect. When skill gaps combine with alert fatigue and data overload, the compounding effect is dangerous. That’s exactly where the case for a dedicated managed NOC partner one that operates as a true extension of your team becomes impossible to ignore.
Monitor network performance continuously, but adjust data collection and active testing frequency based on the criticality of the network, device, and service.
The appropriate frequency should balance detection speed, network scale, monitoring overhead, and business criticality. For example, a core network link supporting a critical service may require near-real-time telemetry and frequent synthetic checks, while a low-priority device may only need periodic polling.
Network performance monitoring for remote workers provides visibility from the user endpoint through the internet and VPN to the applications they access. This helps IT teams identify whether performance problems originate from the endpoint, home network, ISP, VPN, or application.
Key monitoring areas include:
By correlating endpoint, VPN, internet-path, and application data, IT teams can determine whether a remote worker’s issue stems from the local device or network, ISP, VPN infrastructure, internet path, or the application itself.
The gap between owning a monitoring tool and running a monitoring capability is where most enterprise IT teams quietly lose ground.
Buying software doesn’t solve an operational problem. A tool generates alerts. A capability acts on them, escalates intelligently, documents outcomes, and continuously improves. That distinction matters when your infrastructure runs 24 hours a day, but your team doesn’t.
Tool vs. capability is the core tension here. In practice, organizations invest in powerful monitoring platforms and then watch alert queues grow untouched overnight. The software is doing its job; the operational layer around it isn’t. Building that layer internally means hiring for multiple shifts, managing on-call rotations, and absorbing turnover costs. For most IT teams, that overhead isn’t realistic.
A managed NOC functions as the operational layer your team already needs but can’t staff alone. It’s not a replacement; it’s an extension. Escalation paths integrate with your existing workflows, runbooks are built around your environment, and every action taken is visible and documented. Your engineers stay focused on strategic priorities. The NOC handles the alert triage, incident response, and overnight coverage that would otherwise pull them into reactive firefighting.
24/7/365 coverage removes the most dangerous gap in any monitoring strategy: the hours when no one is watching. Network degradation doesn’t schedule itself around business hours, and neither do security incidents. Continuous oversight means teams catch and address issues before they reach users or pile up in a queue of overnight alerts.
And beyond coverage, the shift from gut feeling to data-driven SLAs changes how IT leadership communicates upward. Measurable incident response times, documented escalation outcomes, and operational health reporting replace subjective status updates with proof. That accountability is what transforms a vendor relationship into a genuine partnership.
If you still have questions about how these services integrate with your existing tools and environment, the next section addresses the most common ones directly.
NPM is a broad discipline, and the questions IT teams ask most often reveal just how much confusion still surrounds the tools, the terminology, and the boundaries of what monitoring can actually do.
Yes. Microsoft offers Azure Monitor alongside Network Watcher for Azure-hosted infrastructure. Network Watcher handles tasks like connection troubleshooting, packet capture, and topology visualization, but it’s scoped to Azure environments. For hybrid or on-premises networks, you’ll need a third-party NPM solution to close the visibility gap.
Unauthorized monitoring often leaves subtle signals: unexpected processes running on network devices, unfamiliar SNMP community strings, or unrecognized traffic flows appearing in NetFlow data. A routine network audit that reviews active monitoring agents, checks firewall rules, and audits administrative access logs will surface most anomalies. Consistent logging and alerting on configuration changes is your first line of defense here.
NPM monitors the health and performance of network devices and connections, including latency, packet loss, bandwidth utilization, and device availability. NetFlow analysis goes deeper into traffic behavior by capturing metadata about which applications, users, and endpoints generate that traffic. They’re complementary, not competing. In practice, NPM tells you something is wrong; NetFlow helps you understand why and who’s responsible.
NPM tools aren’t purpose-built security solutions, but they do surface the behavioral anomalies that often precede or indicate a breach: sudden bandwidth spikes, unusual east-west traffic patterns, or unexpected device behavior. When integrated with SIEM platforms, NPM data becomes a meaningful layer in your broader security posture.
Understanding these distinctions sets the foundation for the key takeaways every IT stakeholder should carry forward from this guide.
Network performance monitoring isn’t optional infrastructure housekeeping; it’s a foundational capability that determines whether your digital transformation initiatives succeed or quietly stall.
Every section of this guide has built toward a single conclusion: reactive monitoring is a liability your business can no longer afford. Before you audit your own strategy, here’s what to carry forward.
In practice, the organizations that get the most from NPM aren’t the ones with the most tools; they’re the ones with a clear operational model behind those tools. That means defined escalation paths, measurable SLAs, and a partner who treats your infrastructure with the same urgency you do.
The right monitoring strategy doesn’t just tell you what broke. It tells you what’s about to break and who’s already working on it.
That raises the natural next question: does your current stack actually give you that level of visibility? The next section walks you through how to find out.
The most dangerous gaps in your network performance monitoring strategy aren’t the ones you know about; they’re the blind spots you haven’t discovered yet.
Gap analysis starts with an honest inventory of what your current monitoring stack actually covers. Map every segment of your infrastructure core switches, WAN links, cloud gateways, virtualized workloads against what your tools are actively measuring. Where you can’t answer “who alerts on this, and how fast?” you’ve found a blind spot. Common gaps include unmonitored east-west traffic between internal segments, cloud-native workloads outside your on-premises tooling, and network paths that only surface as problems during peak load.
Identifying blind spots requires looking beyond device-level uptime. In practice, a device can report “up” while silently dropping packets, degrading application response times, and frustrating end users. Pull your last 90 days of incident tickets and ask: how many issues were reported by users before your monitoring caught them? That ratio is your blind spot index, and for most organizations, it’s uncomfortably high.
An operational audit moves the conversation from tool coverage to team capacity. You may have the right monitoring platform and still lack the human bandwidth to act on what it surfaces. Overnight alert fatigue, undertriaged tickets, and delayed escalations don’t signal a technology failure; they signal an operational one. That’s exactly the moment to evaluate whether a managed NOC partnership closes the gap faster than another hiring cycle.
As ExterNetworks’ mission makes clear, the goal is to operate as an extension of your team, not to hand you another tool to manage. You deserve infrastructure coverage that’s predictable, proactive, and built around your escalation workflows, not generic ticket queues.
If your audit surfaces coverage gaps, staffing pressure, or escalation friction, don’t let those findings sit in a slide deck. Request an operational audit, and let’s map a path to infrastructure confidence together.
See how ExterNetworks can help you with Managed NOC Services
Contact Us